 INTERMODAL
One shipment.
Three modes.
Zero gaps.
2.4M+
Containers moved annually
28–40%
Avg. savings vs. truckload
97.1%
On-time delivery rate
300mi
Drayage radius covering every major port complex and Class I ramp in the continental US — no subcontracting, no gaps.
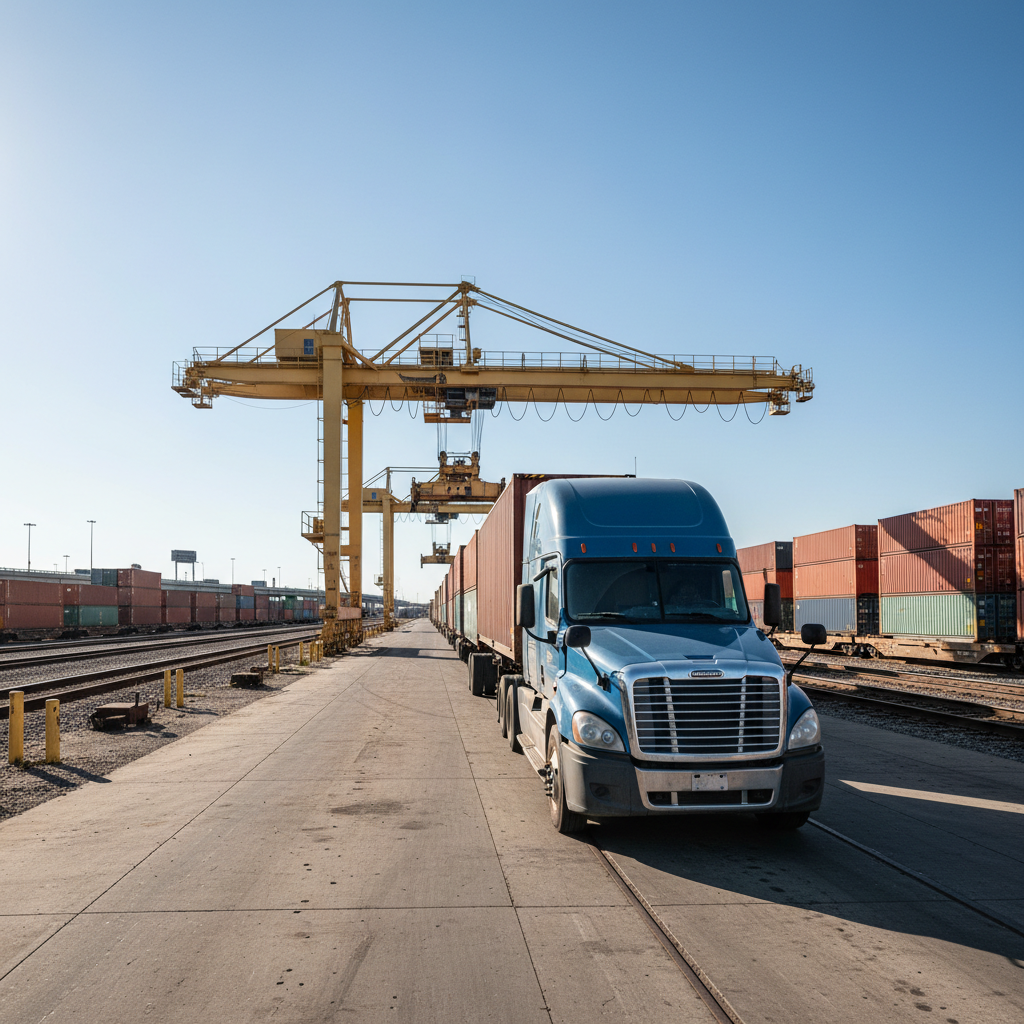
Drayage that shows up on time, every time.
300mi
Max drayage radius, any major port or ramp
47
Class I ramp connections nationwide
6.2hr
Avg pickup-to-ramp time, top 10 markets
Port & Ramp Drayage
Dedicated power units positioned at 23 port complexes and 47 rail ramps — no third-party brokering, no capacity surprises on Monday morning.
Appointment Coordination
Automated gate appointment booking synced to rail ETAs. Your driver arrives when the container is actually ready, not four hours before.
Chassis Management
Proprietary chassis pool across all served markets. No chassis splits, no per-diem surprises, no finger-pointing between carriers.
Real-Time Visibility
GPS-tracked to the container level. Know exactly where your dray unit is relative to the ramp cutoff — not just "in transit."
28–40%
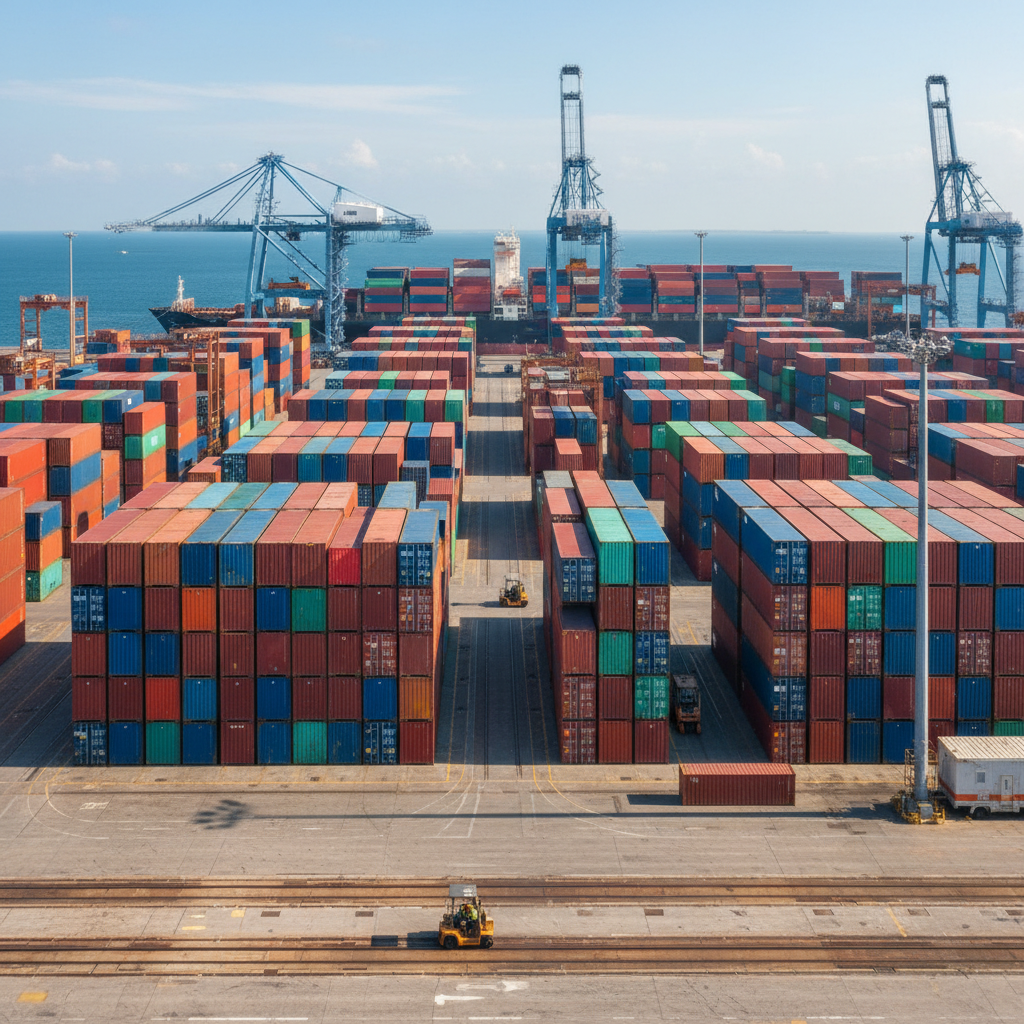
Real freight savings versus truckload — not the 12–15% on the rate sheet. When you factor in fuel efficiency, driver shortage insulation, and contract stability, the spread widens.
Rail moves your freight farther,
for less.
3.2
Avg transit days, coast-to-coast
Chicago → LA on single Class I
$1.39
Per mile, intermodal spot rate
vs $2.20+ truckload average
75%
Fewer GHG emissions vs trucking
Per ton-mile, EPA methodology
280
Trucks replaced per train
Double-stacked 53ft containers
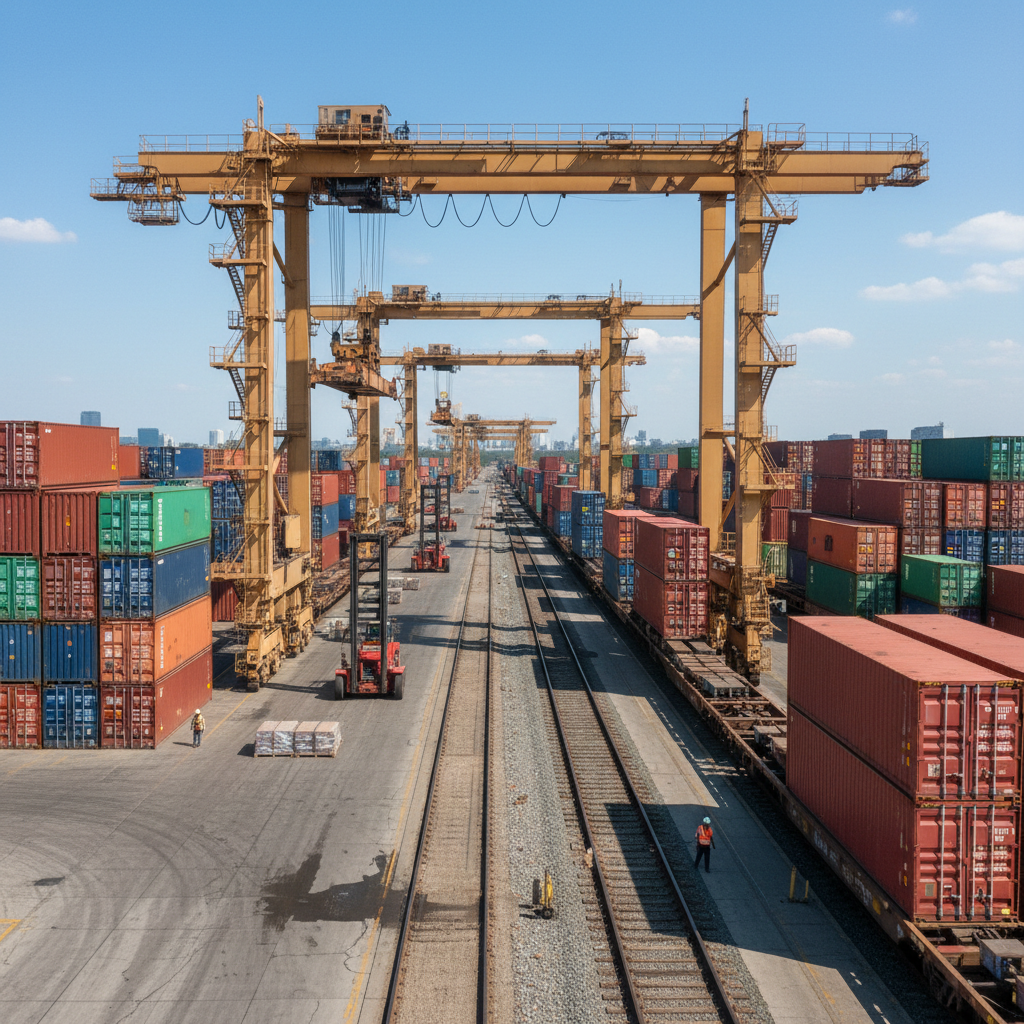
Contracted pricing across all 7 Class I railroads.
We maintain published rate matrices on every Class I network — and interline pricing between them. Your freight doesn't stop at a railroad boundary.
"An intermodal train carries the load of 280 trucks. We've built the contracts to fill them."
— Network Operations, Intermodal

14M
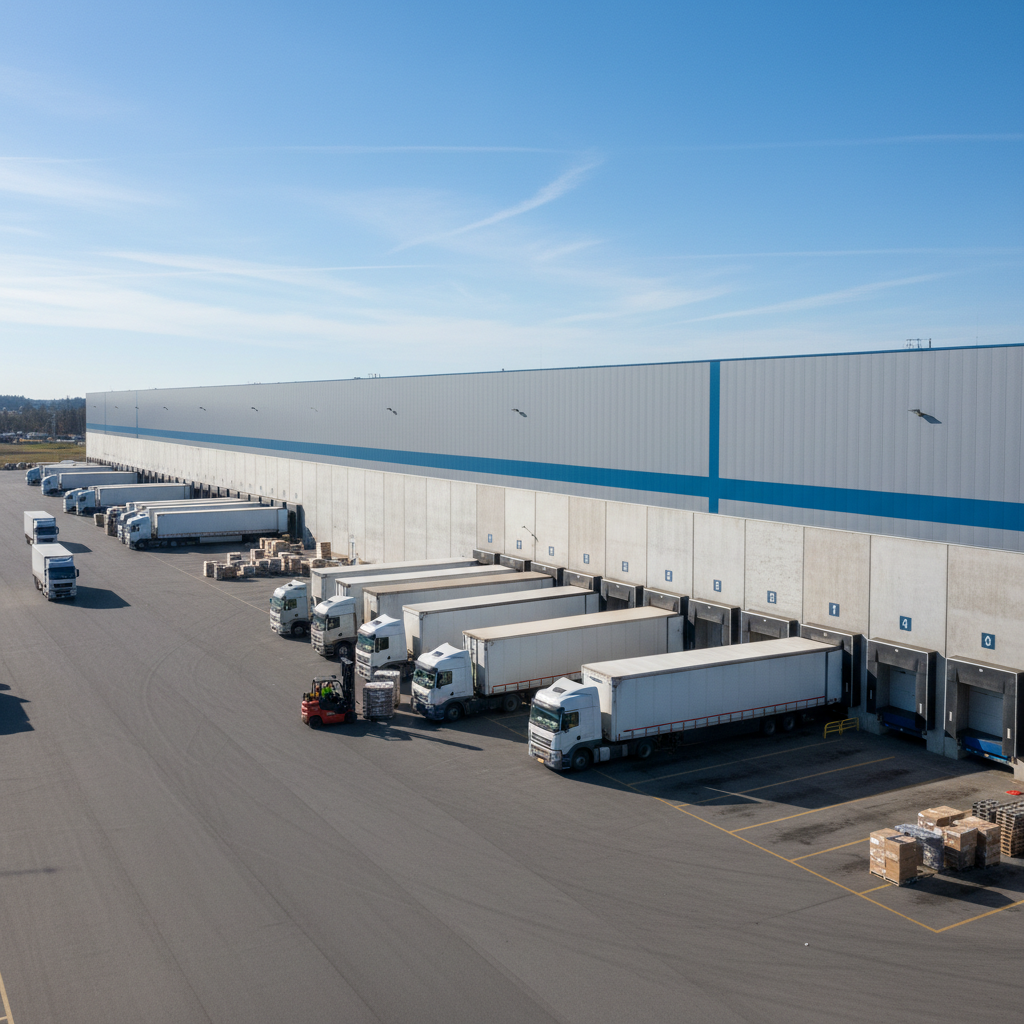
Square feet of transload capacity — the connective tissue between rail delivery and your distribution network.
The handoff is where supply chains break. Ours don't.
14M
Sq ft transload capacity
Across 31 US markets
48hr
Container-to-shelf turnaround
Top 10 distribution markets
99.4%
Inventory accuracy rate
WMS-verified, audited quarterly
Transload Operations
48hr turnRail container to domestic 53ft trailer in under 48 hours. No dwell charges, no missed delivery windows.
Cross-Dock Facilities
31 marketsMerge inbound rail freight with regional truckload for final-mile delivery — one stop, not three.
Container Management
Zero pass-throughsWe own and manage the container. No per-diem, no detention, no chassis fees passed through at month-end.
Inventory Visibility
99.4% accuracyReal-time WMS integration with your ERP. Know exactly what is in our facility, and when it ships out.

83%
of shippers say 3PL is ideal for intermodal
Supply Chain Outsourcing Research, 500+ shippers
18M+
intermodal units moved in the US in 2024
IANA Annual Report 2024
700mi
minimum lane length where intermodal wins on cost
Industry breakeven analysis
Built for the people
who feel the gaps.
Every client type we serve has a specific problem intermodal solves — and a specific reason they haven't switched yet. Here's what changes when you do.
Freight Brokers
Juggling capacity across 5 carriers per lane
One contract, one carrier, one rate — across all three modes.
Distribution Managers
Per-unit costs climbing with no trucking relief in sight
Rail linehaul cuts your cost-per-mile 28–40% on lanes over 700 miles.
3PL Ops Directors
Stitching together dray + rail + dray with three separate vendors
We own the entire move. One invoice, one point of contact, one SLA.
–15%
Freight expense reduction after switching to rail-served distribution
Walmart activated 12 rail-served distribution hubs in 2024, cutting freight expense 15% compared with trucking-only lanes. At scale, intermodal doesn't just save money — it restructures your cost curve.
Get a lane quote.
Today.
Fill in your lane details and we'll return a fully-loaded intermodal rate — drayage, rail, destination dray — within 4 business hours.
Network Map
All ramps, ports, and facilities
Download our full coverage map — 47 ramp connections, 23 port complexes, 31 transload markets. See if your lanes are covered before the call.
What you get
Full rate in 4 business hours — all three modes
Single invoice, single carrier SLA
No commitment, no obligation
Ops specialist assigned to your account
4hr
Rate response guarantee
Business hours, Mon–Fri. Your rate deadline won't wait — neither do we.